
The Data Agent Stack - Part 5: Tools, Query Execution, and the Analyst Loop
Why fewer tools beat more tools

More tools feel like more capability.
For a data agent, they often mean more ways to be wrong.
The dangerous part is not that the agent can write SQL. It is that it can run SQL, trust the result, and publish the answer before anyone notices the wrong tool was used.
A human analyst can choose between five internal tools because they know the politics, history, ownership, and trust hierarchy behind them. A model sees five tool descriptions that sound similar and has to guess.
That is where the agent starts to drift.
A data agent needs a curated tool surface, not every internal system exposed at once. Tools define what the agent can inspect, execute, verify, and publish. If that surface is noisy, overlapping, or unclear, the model is not just answering the user’s question. It is also guessing how your organization resolves trust.
That usually does not end well.
Part 1 framed the data agent as a governed analysis loop.
Part 2 argued that no agent architecture can save messy data.
Part 3 showed why context assembly is the hard part.
Part 4 argued that schemas describe shape, but pipeline code explains meaning.
Now we get to the layer where the agent acts.
More tools are not always more capability
The natural first version of a data agent is usually generous.
Give it the catalog. Give it the warehouse. Give it the metric registry. Give it Airflow, Spark, dashboards, notebooks, Slack, docs, lineage, query history, and every internal helper API.
This feels reasonable. Data questions are messy. More tools should help.
But the agent does not experience tools the way a senior engineer does.
A senior engineer knows that one catalog is stale for a few domains, the metric registry is canonical for business definitions, dashboard metadata is useful but not authoritative, and the warehouse is the source of truth for what exists right now.
The model sees a menu.
If two tools can answer “what table should I use for retention?”, the model has to pick. If both tools return plausible but different answers, the agent has to reconcile them. If neither tool describes its authority clearly, the agent may choose based on phrasing instead of trust.
This is why tool curation matters.
OpenAI’s public writeup calls out “Less is More” as a practical lesson: exposing the full tool set caused problems because overlapping functionality confused the agent, so the team restricted and consolidated tool calls. ByteByteGo’s public breakdown reports the sharper version of the same pattern: earlier versions exposed around 40 tools, and reliability improved after the tool surface was reduced, capped, and stripped of overlapping functionality.
The exact number is not the lesson.
The lesson is that overlapping tools create ambiguous action space.
“The model is better at reasoning than choosing between near-duplicate tools.”
The same lesson applies to context.
Spotify’s public writeup on its data assistant describes expert-owned domain clusters with datasets, vetted question-SQL pairs, and docs. During curation, only 12.5% of proposed query pairs were accepted; the rest included ad-hoc exploration, debugging sessions, wrong-table queries, or technically correct queries that taught bad patterns.
Query history is useful, but most of it is not a playbook.
My read is that a tool menu is also context.
If the menu teaches the model that five sources are equally valid, the model will treat them as equally valid. If the system knows one source is canonical and another is advisory, that authority has to be encoded in the tool surface.
If you remember one picture from this post, make it this one:
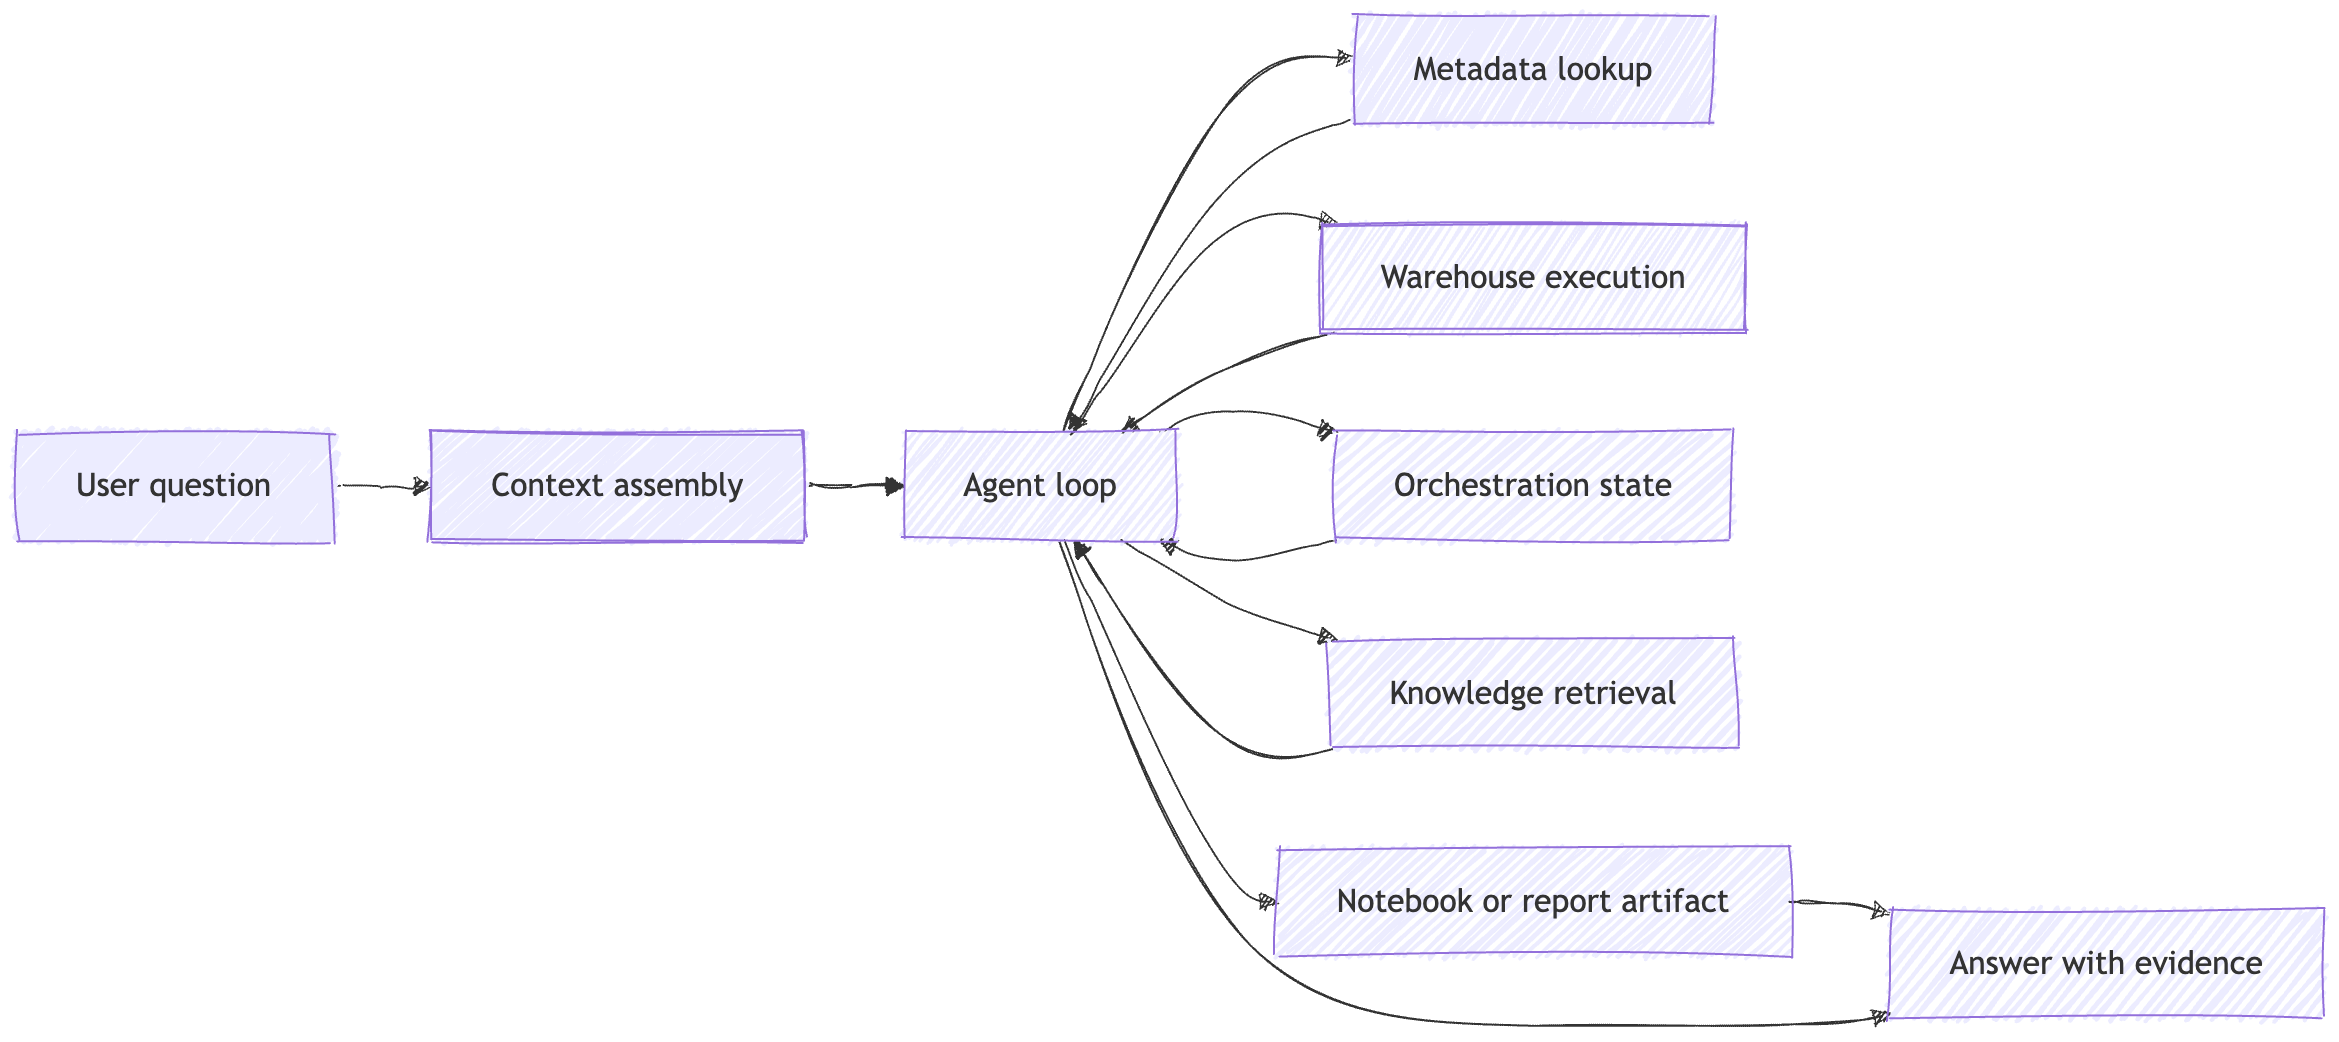
A good data agent does not need every internal system.
It needs a small set of high-authority tools that return useful observations back into the analysis loop.
A tool surface is a contract
A tool is not just an API wrapper.
It is a contract between the runtime and the model.
“A tool is not an API wrapper. It is a capability boundary around what the system can do.”
That contract should answer six questions.
Tool availability: Can the model call this?
Tool authority: Is this source canonical, advisory, historical, stale, or exploratory?
Tool execution: Does this read metadata, inspect live data, run SQL, publish an artifact, or modify something persistent?
Tool permission: Whose identity and access scope does the tool use?
Tool output: Does it return rows, warnings, source links, summaries, traces, or a report?
Tool evidence: Can the user inspect what happened?
Those distinctions matter.
A metadata lookup tool is not the same as a warehouse execution tool.
A warehouse execution tool is not the same as a publishing tool.
An Airflow lookup is not the same as a semantic-layer lookup.
A code search tool is not the same as a catalog search tool.
Same label, different authority.
For a production data agent, the tool surface usually needs a few clear categories.
Metadata lookup tools answer questions about tables, columns, owners, freshness, lineage, tiers, deprecation status, and usage.
Warehouse execution tools run SQL or inspect live data through a bounded path with validation, limits, and result links.
Runtime context tools check facts that offline context cannot know: live schemas, partitions, sample values, null counts, row counts, distinct values, and freshness.
Orchestration and platform tools inspect Airflow, Spark, dbt, Dagster, logs, retries, SLAs, and job health.
Code search tools trace transformation logic, pipeline code, source-to-target mappings, and lineage through code.
Knowledge retrieval tools retrieve docs, incident notes, Slack threads, launch context, metric definitions, and team caveats.
Publishing tools create notebooks, reports, markdown summaries, dashboard drafts, or PR-linked artifacts.
Workflow tools package recurring analyses into reusable plans with known assumptions and validation steps.
OpenAI’s public post describes runtime context that can issue live warehouse queries when prior context is missing or stale, and can also consult metadata services, Airflow, and Spark for platform context outside the warehouse. GitHub’s Qubot writeup shows another version of the publishing surface: results are stored as a markdown report in a pull request so users can reference, refine, or use the query in a dashboard.
This is the systems point:
A tool description tells the model how to call something.
A tool contract tells the system what must remain true when it is called.
That is a very different bar.
The analyst loop is observe, act, verify, revise
Text-to-SQL is often shown as a straight line.
Question.
SQL.
Rows.
Answer.
That is not how real analysis works.
A real analyst asks a question, forms a plan, checks table definitions, inspects values, writes a query, sees an empty result, revises a filter, checks a join, notices a freshness issue, asks a clarifying question, reruns the query, and only then writes the answer.
The agent version should work the same way.

ReAct is a useful framing here, but it should not take over the post.
The ReAct paper describes interleaving reasoning and task-specific actions, where reasoning helps update plans and actions gather information from external systems. Spotify’s assistant describes a similar loop in data-agent terms: pick context, write SQL, run it, observe tool results, adjust, and return the answer with query and sources.
In data-agent terms, the agent should not treat the first plausible SQL query as the answer.
It should alternate between plan, tool call, observation, validation, and revision.
Meta’s Analytics Agent writeup describes the same shape: the agent can write code, execute it, see real results, and decide what to investigate next. Their example is an agent investigating a signup drop by querying data, checking for a logging change, finding a deploy that altered an event schema, and surfacing the root cause through a chain of queries.
That is the analyst loop.
Not one query.
A sequence of observations.
This is where tool design changes answer quality.
If the agent can only generate SQL, it can produce a plausible query.
If it can inspect schema, sample values, freshness, lineage, and orchestration state, it can notice that the plausible query is wrong.
If it can run bounded queries and read the result, it can catch empty rows, suspicious joins, out-of-range values, missing partitions, or null explosions.
If it can publish SQL, assumptions, sources, and result links, the user can verify the answer.
That final step matters.
OpenAI’s data-agent post says the agent summarizes assumptions and execution steps, and links to underlying results so users can inspect raw data and verify the analysis. Meta says every data point surfaced by its Analytics Agent is accompanied by the SQL query that produced it. Pinterest’s writeup describes returning SQL, tables, date ranges, source references, and warnings.
A data agent should not just answer.
It should show the work product behind the answer.
Safe execution is part of the tool design
A data agent with warehouse access can do useful work.
It can also do expensive, misleading, or unsafe work very quickly.
That means safety cannot live only in the system prompt. It has to live inside the execution path.
A safe SQL tool should not simply accept a string and run it.
It should validate the plan before it spends money, scans tables, or publishes numbers.
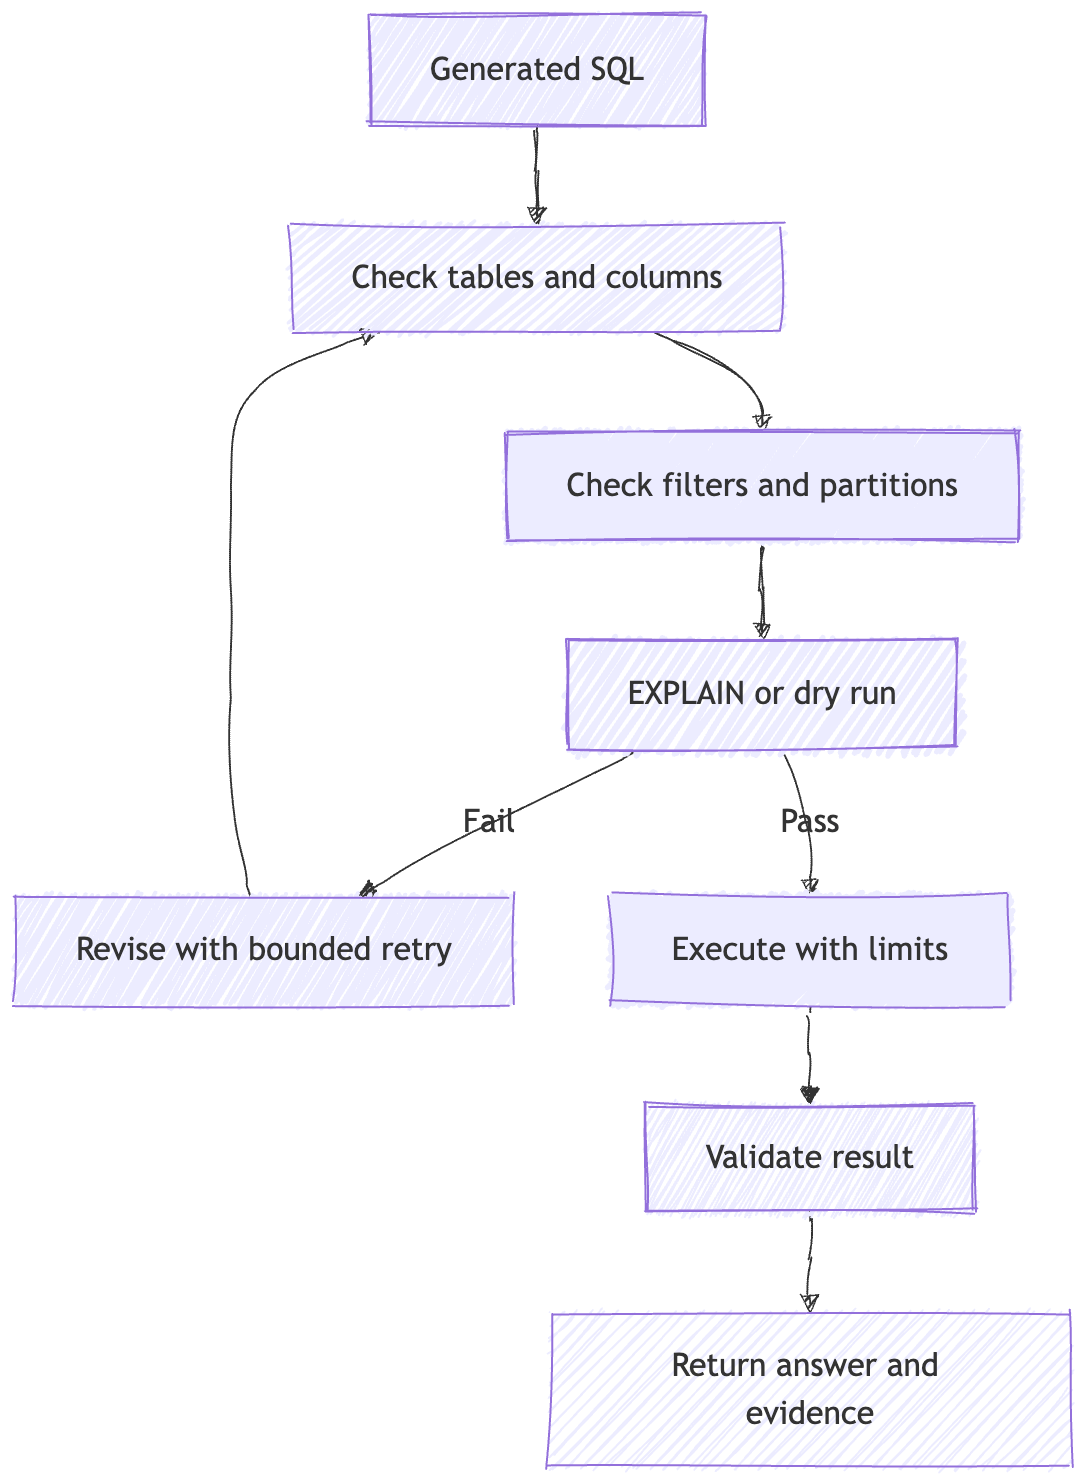
At minimum, the execution path should check:
Do the referenced tables exist?
Do the referenced columns exist?
Is the query using the intended grain?
Are partition filters present where needed?
Are date ranges bounded?
Are filter values valid?
Are joins known or at least plausible?
Is the query read-only?
Is the result size bounded?
Is there a timeout?
Is there an EXPLAIN or dry-run step?
Are retries bounded?
Does the final answer include SQL and evidence?
Pinterest’s public writeup gives a concrete version of this design. Their agent uses MCP tools for table search, query search, knowledge search, and Presto execution with EXPLAIN validation. The execution path includes EXPLAIN-before-EXECUTE, tight limits, bounded error recovery, table and column validation, filter-value checks from column profiles, known join keys, conservative row limits, and transparent result output.
Grab’s engineering post shows the same production instinct in a different architecture. Their system uses input classification for PII and out-of-scope requests, validates SQL for PII columns and DDL/DML operations, detects slow-query patterns such as missing partition filters or excessive date ranges, validates schemas, enforces timeouts, and requires human review for code changes.
That is what safe execution looks like as a tool contract.
“A data agent should not discover safety by running expensive queries in production.”
The same principle applies beyond SQL.
A metadata tool should report freshness and caveats, not only schema.
A code search tool should return the relevant transformation path, not an unbounded dump of source files.
An orchestration tool should distinguish “pipeline succeeded” from “data is complete for this business question.”
A publishing tool should require evidence links, not just prose.
A workflow tool should carry versioned assumptions, not invisible habits.
If a tool can act, the tool needs guardrails.
If a tool can publish, the tool needs provenance.
If a tool can modify, the tool needs approval.
I am only naming permissions here. Part 6 is where they become the main story. For Part 5, the key point is simpler: execution safety starts in the tool.
Interrupts, defaults, and workflows make the loop usable
A data agent is not only a backend system.
It is an interactive analyst surface.
That means the runtime has to handle the messy parts of collaboration.
The user changes their mind.
The user asks a vague question.
The user disappears.
The agent spends five minutes on the wrong breakdown.
The same weekly analysis keeps getting repeated.
These are not edge cases. They are normal analyst workflows.
OpenAI’s public post describes this interaction pattern directly: the agent carries context across turns, accepts mid-analysis interruption and redirection, asks clarifying questions when instructions are unclear, applies sensible defaults when the user does not respond, and packages recurring analyses into workflows such as weekly business reports and table validations.
There are four control semantics here.
Clarifying question. The agent pauses before acting because the ambiguity is too expensive or risky.
Example: “Do you mean gross revenue or net revenue?”
Sensible default. The agent proceeds, but it surfaces the assumption.
Example: “I used the last 30 days because no date range was specified.”
Interrupt. The user can redirect a long-running analysis before it finishes.
Example: “Actually, break this down by region first.”
Workflow. A recurring analysis becomes a reusable plan with known inputs, steps, validations, and output format.
Example: “Run the weekly activation report.”
These are easy to treat as UX features.
They are more than that.
They are control-plane semantics for analysis.
A clarification decides whether the run should continue.
A default decides which assumptions enter the plan.
An interrupt decides whether old tool calls should be canceled, ignored, or superseded.
A workflow decides whether a stored plan is still valid for the current question.
Meta’s Recipes are a good example of reusable analysis plans. Recipes can encode reference experts, persistent instructions, custom validations, and tool controls. The key design principle is that recipes define how to analyze, while data definitions live in a separate layer.
That separation matters.
A workflow should not silently redefine the metric.
A workflow should not hide stale filters.
A workflow should not keep using an old table because it worked last month.
Reusable does not mean safe forever.
A workflow is code-adjacent. It needs ownership, versioning, evaluation, and deprecation.
My read is that this is the real production line:
A data agent can be more autonomous only when the tool surface becomes more constrained, more observable, and more governed.
Not less.
Failure modes
1. Overlapping tools return conflicting answers
The catalog says one table is canonical.
The metric registry points somewhere else.
The dashboard uses an older table.
The model picks one because the tool name sounded more relevant.
The fix is not a better prompt. The fix is an authority hierarchy.
2. The model chooses the wrong source because authority is unclear
The catalog says one thing.
The metric registry says another.
A dashboard query shows a third pattern.
A high-volume historical query points somewhere else.
The model treats all of them as equal because the tool surface never told it which source is canonical, advisory, stale, or exploratory.
3. Metadata lookup is used when live inspection is required
The table description looks right, but the actual partition is missing.
The schema says the column exists, but the current production table has not been backfilled.
The query returns zero rows because a filter value is wrong.
Static metadata is not enough when the question depends on runtime state.
4. Long-running analysis continues after the user redirects
The user says, “Actually, use paid users only.”
The agent already started a broader query and keeps going.
Now the answer is technically well-formed but scoped to the wrong population.
Interrupts need semantics. They cannot just be another chat message.
5. Defaults are applied silently
The agent assumes last 30 days.
Or US only.
Or production traffic.
Or logged-in users.
Or is_test = false.
Those may be good defaults. They are still assumptions. If they are not visible, the user cannot verify the answer.
6. Query execution lacks cost controls
The query has no partition filter.
The date range is unbounded.
The join explodes.
The retry loop keeps trying.
A data agent should not learn that a query is expensive by scanning half the warehouse.
7. Results are summarized without evidence
The answer says revenue was up 8%.
No SQL.
No table list.
No date range.
No metric definition.
No warning about missing data.
That is not an analytical answer. It is a plausible sentence with a number attached.
8. Reusable workflows encode stale assumptions
A weekly report workflow keeps using a deprecated table.
A validation workflow checks yesterday’s schema contract, not today’s.
A launch analysis workflow still applies a filter from a previous experiment.
Workflows make work repeatable. They can also make failures repeatable.
Builder checklist
Use this checklist when designing a data-agent tool layer.
Curate tools by authority, not org chart. The model should see trusted capability boundaries, not your internal platform topology.
Remove overlapping tools. If two tools answer the same question, merge them or define a clear authority order.
Keep read-only lookup separate from execution. Metadata lookup, live inspection, SQL execution, publishing, and modification should not share the same authority.
Put safety in the SQL path. Add dry run, EXPLAIN, row caps, timeouts, date bounds, partition checks, cost controls, and bounded retries.
Validate before running. Check tables, columns, filters, join keys, grain, and known metric constraints before expensive execution.
Make defaults visible. Defaults are fine when they are surfaced. Hidden defaults are silent data bugs.
Support interrupts and redirects. A long-running analysis needs cancellation, supersession, and stale-result handling.
Version reusable workflows and log evidence. Store tool calls, SQL, result links, assumptions, warnings, sources, workflow versions, and final answers.
Recap
A data agent does not need every tool in the company.
It needs the right tools.
The smallest useful tool surface lets the agent inspect, execute, verify, and explain the answer safely.
That means fewer overlapping tools, clearer authority, bounded query execution, visible assumptions, interruptible analysis, reusable workflows with versioned assumptions, and evidence attached to every answer.
The analyst loop is the product.
Not the SQL string.
Not the tool menu.
Not the chatbot wrapper.
The loop.
Plan. Inspect. Execute. Observe. Validate. Revise. Explain.
That is what turns natural language into a trustworthy data answer.
What comes next
Part 5 was about what the agent can do.
Part 6 is about what the agent is allowed to do.
Once a data agent can retrieve docs, inspect tables, execute queries, and publish answers, the tool surface becomes a trust boundary. The question shifts from “can the agent run this?” to “is this user allowed to know the result?”
That is where pass-through permissions, institutional knowledge access, memory scope, prompt injection, data exfiltration, audit logs, and governance become the main story.
If you are building this
If you are building a data agent, analytics agent, BI copilot, warehouse assistant, or metrics system, where does the tool surface break first?
Is it overlapping metadata tools, unclear execution authority, expensive queries, stale defaults, missing interrupts, unsafe publishing, or lack of evidence?
I would love to hear what failure mode you have seen in real systems, reply in comments.
The Data Agent Stack Series
Subscribe for the future parts in this series.
References
OpenAI, Inside OpenAI’s in-house data agent and ByteByteGo, How OpenAI Built Its Data Agent
Spotify Engineering, Encoding Your Domain Expert: The Context Layer Behind Spotify’s Data Assistant and Yao et al., ReAct: Synergizing Reasoning and Acting in Language Models
GitHub Blog, How we built an internal data analytics agent and Meta, Inside Meta’s Home Grown AI Analytics Agent
Pinterest Engineering, Unified Context-Intent Embeddings for Scalable Text-to-SQL and Grab Engineering, From firefighting to building: How AI agents restored our team’s core productivity
Luo et al., Data Agents: Levels, State of the Art, and Open Problems